Analytic Charts
Visual Analytic charts can be used to gain insights and explore the links between Entities that may not be obvious when looking at a data list. Modal analytic charts allow you to "join the dots" and reveal insights. If your team needs to “join the dots” in data and reveal insights, ModalConnect supports this with proven data visualization tools that are clear and clutter free enabling you to make those connections.
Analysis and production is supported using ModalConnect’s Visual Analytics using a powerful, flexible fast and insightful graph visualization and link analysis tool supporting the ability to distil complex connected critical intelligence insights, revealing insights between people, places, objects and events.
Articles in this Topic
Access Analytics
There are 3 ways to access and view the Analytic Charts.
1: From the top main menu select Analytics which opens in a new tab.

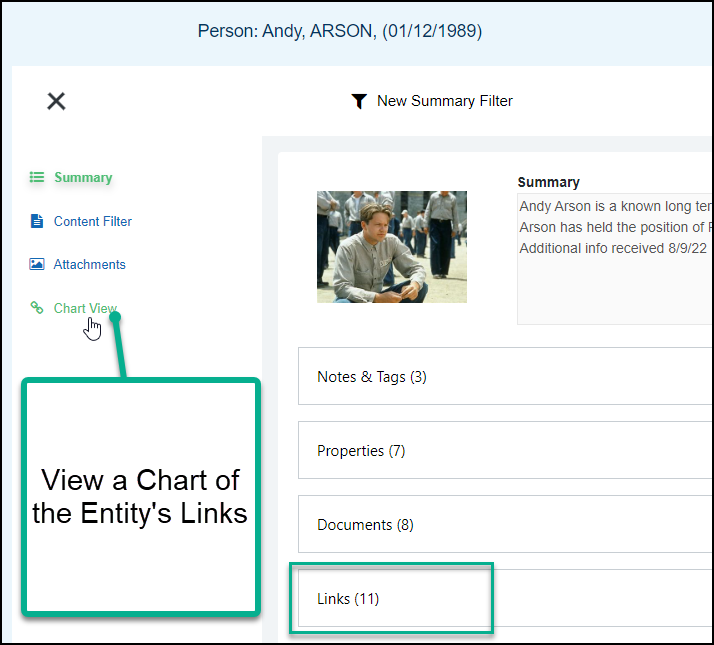
2: From the Links page in a Document select Chart View which generates a chart showing the Document's Entities and Links.

3: From the Entity Profile by selecting Chart View which opens Analytics and generates a chart showing the Entity's direct Links.
Note: Analytics always opens in a new tab.
The Chart surface has the Search pane and filters on the right side, navigation controls on the left and the central chart viewing surface area.

Charts are created by searching for an Entity.
Entity Searches are made using the Data Source (default setting) which searches Entities in Modal Connect.
Once a Chart has been created the Search Chart function can be used to search the chart for Entities or Link Type within the chart.
Search Terms
Enter the search terms which must include any of an Entity's Properties for example an Entity's name or Title and\or unique id and\or birth-date etc and select the appropriate Search Type filters.
Only 1 Entity at a time* can be searched for. Additional Entities can be searched for to add to an existing chart following the creation of the initial chart.
*see the search conditions.
Search conditions can be applied to the search terms to provide an exact match, widen the search or even to exclude terms, these are detailed in the Search tips. Hover over the info icon  to view these Search Tips or click on the info icon to keep open to view (click away from the search tips to close).

Note: Search terms are not case sensitive so it is not necessary to capitalise names or titles.
Entity Results are sourced from all of the Entity's Properties so the search term may not necessarily be visible in the Entity label (Name or Title) shown on the chart. Example Searching for John Smith and the results returned include Gary Smith because this Entity has a middle name Property of John
- Exact match for a single term; in the Search terms field enter in the Entity word or term to be searched for, e.g Smith.
Results will include any Entity with the search term (in the properties from the Source Filter selected) and those Entities will be highlighted in the chart. Any linked Entities also show on the chart but are not highlighted.
- AND word search; used to search for Entities with two or more words\terms. Enter the Entity words\terms and separate each word or term with a space, the space is the 'AND' condition, e.g John Smith
Results will include any Entities with all of the Search words\terms in their Properties e.g both 'John' and 'Smith' and those Entities will be highlighted in the chart.
- Partial searches can be made using the * character which allows an extended search for anything before, within and\or before and\or after the term depending on it's application.
Example, smi*, smith*
Results will include any Entities with Properties that start with smi or smith for example Smith, Smiths, Smyth, Smithy, Smithson.
Example, sm*th
Results will include any Entities with Properties that start with sm and end in th for example Smith or Smyth.
Example, sm*th*
Results will include any Entities with Properties that start with sm and either end with th or with an extension to th. Smith, Smiths, Smyth, Smithy, Smithson.
Example, *smit*
Results will include any Entitiy Properties such as Asmith, Smith, Smiths, Smithy, Smithson
The Entities will be highlighted on the chart and include their direct links to other Entities. Note - result sets are likely to be much larger for partial searches.
Or apply the partial condition * to more than one term. Example , Jo* Smit* or Joh* *mith
- Partial search combined with the 'And' search. Search Terms use the * with the And condition e.g Jo* and Smith
Results will highlight Entities with any properties that start with 'Jo' and also have 'Smith'. EG Jo Smith, Joe Smith, John, Smith, Jolene Smith, etc.
- Exclusion Search. To exclude a search term place a hyphen immediately before the term e.g -Smyth. E,g searching for John Sm* -Smyth. Results will include anything with an exact match for John and also has a property value starting with Sm - Smith, Smithson, Smurf but not Smyth which is excluded.
Exception is if the excluded Entity is directly linked to the other Entity\s John Sm*.


The default search setting is for all Entity Search Types however this can be refined by either removing Types by clicking the x on the Entity Type label or click into the Type field to open the selector where you can uncheck (or select) Entity types to search for. Click OK to confirm your selection. Limiting the Search Types used helps reduce false-positives -e.g where the search term can be found in multiple properties. John could be found as a Name and also in an Address, or Organisation.

Click the Search button or Enter from your keyboard to start the search.
To cancel a Search, click cancel under the search processing dialogue.

Where results include large amounts of data a message displays asking for confirmation to continue before loading the Chart as this may make it difficult to view individual results.

NB: Results that return large amounts of Entities can be too numerous to view or navigate adequately, in this case it is recommended to refine the search terms where possible.
A successful Search shows a Chart with the Entity and the Entity's direct links to other Entities. Entities with no Links that match the search terms will also appear in the Chart. The Chart displays the searched for Entities type icon and name/title highlighted green.
The Links are displayed by the default filter of 'Group All'. The wider the link line the more individual underlying links there are between the Entities.

Where the Analytics page is opened via the Chart Link button from within a Document - a Chart is automatically generated using the existing Entities within that Document. Any unlinked Entities from the Document show as individual Entities.
Where Analytics is opened from an Entity Profile 'Chart View' the Entity is highlighted in the centre with its direct links around it.
The Search pane on the right can be closed by clicking the X (reopen by clicking the bars), this creates more space to view and manipulate Charts.
Group Links determine how Links are displayed on the chart. Click on the down symbol on the label to reveal the Grouping options.
Click on the info icon to see Grouping Tips.

Group All
The default setting for Group Links is the 'Group All' filter. This shows a solid line between entities with an arrow to indicate direction ( From - To). The wider the line the greater the number of links between the Entities.

Group Links by Direction
Select the filter "Group by Direction' to view Links by direction only. This shows combined Links by direction and provides a simplified view of links between Entities particularly where there are multiple links of the same type (due to being created in different documents). The wider the directional link line is represents greater numbers of combined links.

Group Links by Show All
The Show All filter will show each individual link with the direction, the link description and the status type of the link - e.g solid for Confirmed, broken lines for Tentative and close dots for Unconfirmed.

Layouts provide different options for displaying Entities and Links to help with pattern recognition and other user interactions.
Layouts display with whichever Group Links option has been selected.
Click on info icon to view the Layout Options Tips. Click on the down symbols to reveal the Layout options.

- Organic - is the default layout and optimised for large data-sets.

- Sequential - great for showing different levels of sequence and does not cross over links. The orientation can be changed.

- Lens - Layout is circular with more densely connected Entities pushed towards the centre.

- Structural - groups linked Entities in a linear layout - useful for complex data-sets.

- Hierarchy - to use this layout type, first select (click on) the Entity (or for more than 1 Entity use Shift + click to select) to structure the hierarchy for - this enables the filter to be able to select it to show the hierarchy layout. The orientation of the hierarchy can be changed from the default down view.

- Radial - to use this layout type, first select (click on) the Entity (or for more than 1 Entity use Shift + click to select) to structure the Radial layout for. This layout provides a circular tree-like structure.

- Tightness - this slide can be used to bring the Entities closer to the centre which can make it easier to view larger data-sets.
- Orientation - this feature is available for the Sequential and Hierarchy layouts. The default view is down but can be changed to Right, Up or Left.
- Run Layout - this feature can be used with the Organic, Lens or Structural Layouts to provide variations of the chart layout.


Combine Entities Options
This function enables Entities to be selected and combined into a group within a node. Multiple nodes can be created and nodes can be combined. Combined groups and nodes can be useful particularly when working with large data sets.
To create a Group, use Shift + click to select the Entities (so they are highlighted) then click 'Combine'. The Entities will be combined into a node (can select a circle or rectangle). Each Node has a label which can be used to give the Node a name - double click on the label to edit then click Enter.
A node can be minimized by double clicking on the node, the number of Entities within the minimized Node shows on the node. To reset a minimized node (to view the Entities and Links) double click on the node again.
To combine nodes use Shift + click to select the nodes then click Combine.
The Arrangement function can be used to change the arrangement of the Entities within the nodes (applies to all nodes).
Run Layout can be used to provide different views (placement of Entities and nodes) on the chart.
To Uncombine a node, click on the node then select 'Uncombine'.

Entities with a  have other links (beyond the direct links to the Entity search result) which can be shown on the chart by clicking on the

Chart navigation tools on the left can be used to;
- Zoom slide in or out (or scroll from your device) to increase or decrease chart content.
- Direction arrows to move the chart left, right, up or down
- Center - Click the circle to recenter.
- Cursor icon to drag across an area to select content to delete or to move using keyboard \ device direction keys.
- Hand icon (click on the cursor icon to access), can be used to reposition individual Entities or multiple Entities (use Shift key for multiples).

If the chart was accessed via the Document Links page and unlinked Entities are shown this is due to those Entities not having been linked within the Document. Links for the Entities can only be added or updated within the related Document.
Entities and or Links can be deleted from the Chart if not needed to reduce 'noise' and put the focus only on the Entities and Links required.
- Click on an Entity or hold Shift + click to select multiple Entities so they are highlighted then either right click and select Delete Selected Entities or click Delete from your keyboard. The selected Entities and their links are removed from the Chart.

- Alternatively, depending on the volume of Entities and links on the chart it may be easier to select the Entities and Links to keep, in this scenario the selection is inverted.

- Select (click on) the Entities and the Links you want to keep (these are highlighted)
- Right click on the chart and select Invert Select items.
- This will invert the selection so that any Entity or Link not selected will now be selected.
- Next right click on the chart again and select Delete Selected

To return any deleted Links and Entities just click on the icon of the Entity they were linked to.
To add another Entity to the current chart, clear the search terms and enter the Entity's name \terms and select search. Search conditions can be applied. This can be repeated as often as required. The Entity\s added will highlight green.
A search can be made of the current Chart for an Entity. With the Entities filter selected enter the Entity's name in the Search field and click the checkbox for Search Chart and then Search. The focus will move to and highlight the results.

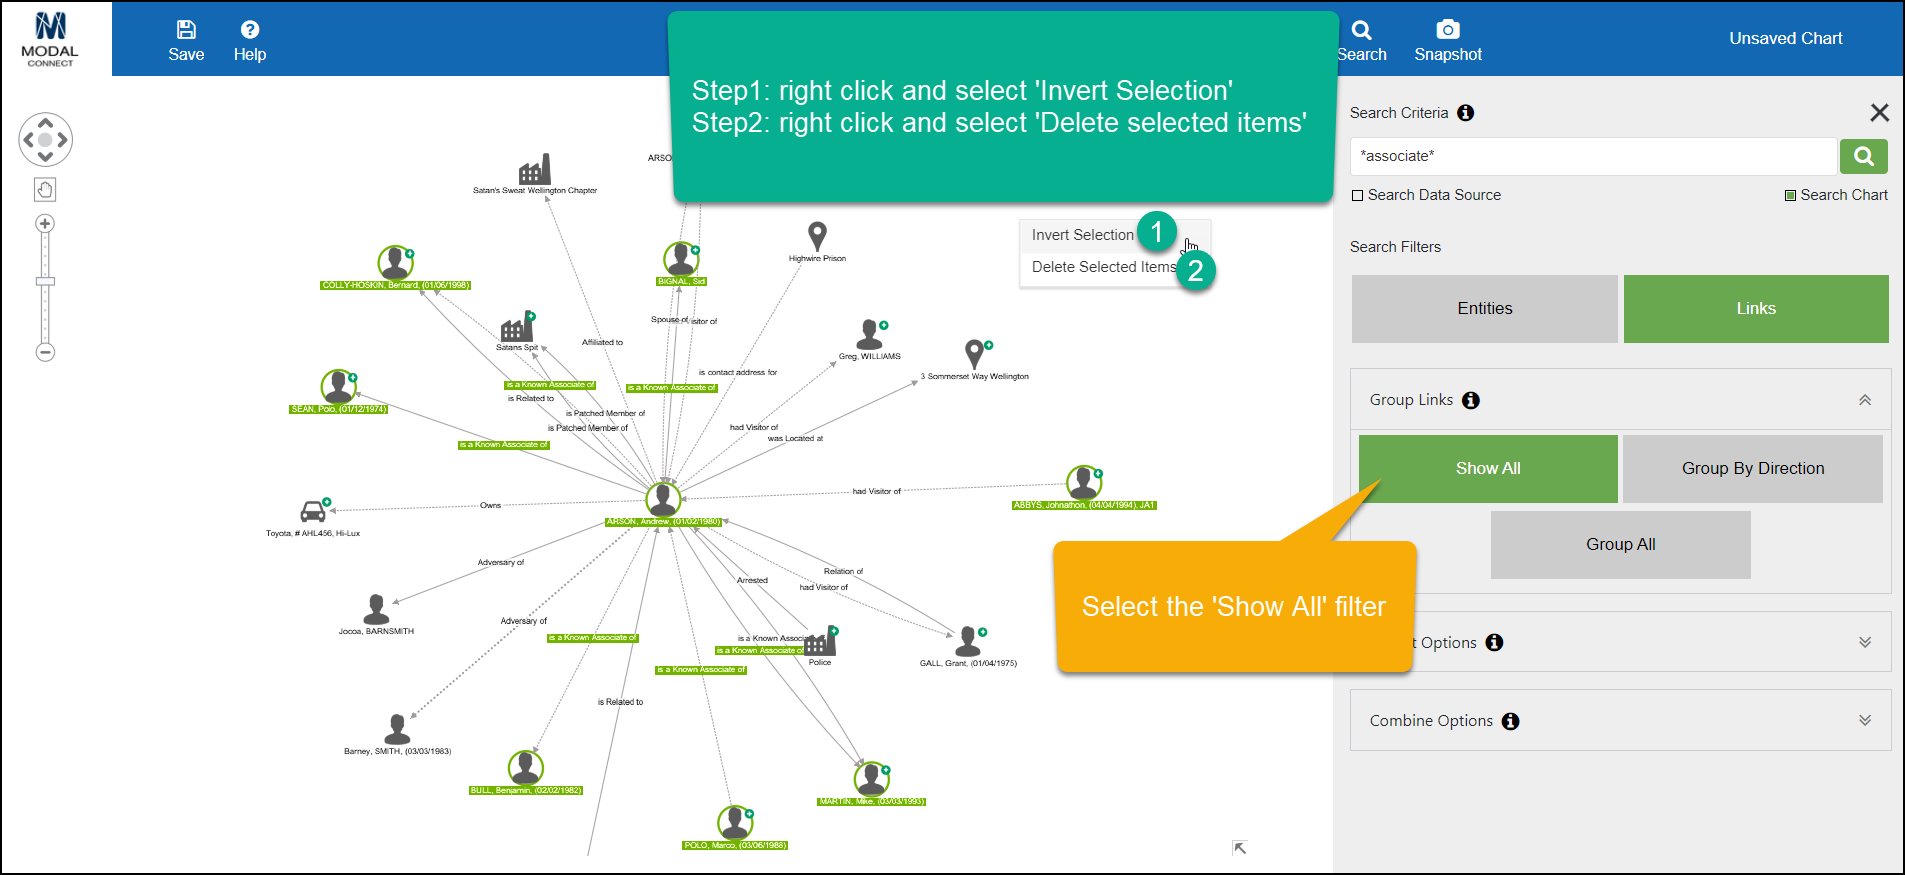
To view Entities in the chart by a Link Type, with the 'Show All' Group Links applied select the Links search filter and check 'Search Chart'. In the search field enter the Link Type full description (must exactly match the full description) e.g - is a Known Associate of, is Related to, is Owner of etc.
Or use the partial condition * against the key term e.g *associate* or *related* or to capture both 'related and relation' use *relat*.

To view or save a chart with just the Entities with a specified Link Type showing, remove all other Entities using the 'invert selection' function. Ensure the 'Show All' links filter is applied first so the Link detail is showing.
- With the Entities and links highlighted (after the search Links), right click on the white space of the chart and select 'Invert Selection'. This selects all the Entities and Links previously not highlighted for the Link Type.
- Next - right click on the white space again and select 'Delete Selected items'
To view a linked Entity's Profile, right click on the Entity and then click on View Entity Profile which opens the Entity Profile in a new tab.

To view the Document\s related to a Link between Entities (with the same status and direction) - right click on the Link (line) and then click on View Documents. This opens (in a separate tab) a list of the Documents that contain that link's description (with the same status) between the 2 Entities.

From the results list, click on the Document title to open it in the same tab or right (or Ctrl +) click to open in a new tab or window.
Charts can be saved to 'Snapshots' within ModalConnect Analytics, then they are available for your future reference and/or editing. Click the Save button in the top left of the top menu - in the pop-up, record a name/title for the Chart (make it unique to avoid duplicates). The Chart is saved and the Snapshot screen opens with the saved chart showing. Any Chart can be saved to your Snapshots.

Only the User that created the Chart (the logged in user) can view their saved Charts.
Note: The Group Links, Layout Options and Combine Options are not available for editing in Snapshots.
Snapshots are created from your saved Charts. Select Snapshot from the Analytics menu. If you have just saved a Chart then Snapshot will already be open.
Note: The Group Links, Layout Options and Combine Options are not available in Snapshots.
Editing a Snapshot
Open the Snapshot page and select the chart name from the Snapshots list. Select Edit from the top menu (or can start edits immediately if the Chart has just been saved). Edits can be made to the Chart e.g expand Links, delete or move Entities. The edited Chart can then be saved which creates another Snapshot which is added to the list of Snapshots for the Chart. The most recently edited Snapshot goes to the top of the Snapshot list. Multiple snapshots can be saved against a Chart.
Any saved Snapshots of the selected chart are shown in the Snapshot list on the right. To view any Snapshot from the list, click on it to view and/or edit. If edited and saved this creates a new snapshot. You can select another Chart to view/edit or click Close to return to the Search page.

View Snapshot Linked Entity or related Documents
Ensure the Snapshot is in Edit mode.
To view the Profile of a Linked Entity - right click on the Entity and then click on View Entity Profile which opens the Entity Profile in a new tab.
To view the Document\s related to a Link between Entities (with the same status and direction) - right click on the Link (line) and then click on View Documents. This opens (in a separate tab) a list of the Documents that contain that link description (with the same status) between the 2 Entities. The Document Titles are hyperlinked to the Document. From the results list, click on the Document title to open it in the same tab or right (or Ctrl +) click to open in a new tab or window.
Delete a Snapshot
To Delete a Chart from your Snapshots - select the Chart Name and click delete (bin icon). The Chart and all of it's Snapshots are deleted.
To remove a Snapshot from the list of Snapshots for a Chart, click the X alongside the Snapshot image listing on the right.

Close or Exit Snapshots
To exit the Snapshot screen and return to the Analytics main Search screen click Close.
Watch the Videos
Viewing Tips
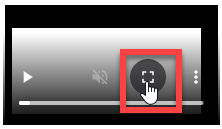
To view a video at full screen, click on the 'Full screen' button.
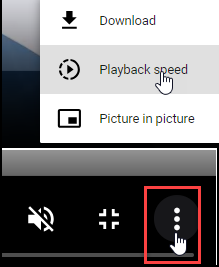
To adjust the playback speed (decrease or increase) click on the 3 dots and select Playback speed.
Captions display best if the mouse or touch-pad are not moved or engaged once playing.
Videos have no audio.
| Create a Chart | View Entities in chart by Link Type |
| Chart Layout Options | Chart Snapshots |